Fleet Manager
A fleet console for connected devices: online status, boot and state history, live health, telemetry over time, and OS and app updates over the air. It runs our own fleet of about 75,000 devices online at 99.9% uptime, and we adapt it to your product, so your team builds the features your customers pay for, not fleet tooling.
Devices online in our own fleet
Defect rate in volume production
Secure OTA releases
Countries our devices ship to
What it saves you
Every connected product needs fleet tooling before its first pilot: device status, logs, metrics and safe updates. Built from scratch, it delays the product your customers are waiting for.
Devices you can't see
Without status and history, every support case starts with a guess or a site visit.
Updates that need a cable
System and application updates done by hand don't scale beyond a pilot.
Months of internal tooling
Dashboards, telemetry storage and update channels take months before they are reliable.
How it speeds up your product
Less risk from day one
Fleet status, telemetry and updates already run our own fleet of about 75,000 devices, so your project doesn't carry their technical risk.
Costs less than starting from scratch
The project covers adapting a working console to your product, which costs less than building fleet tooling from zero. Your budget goes into your features.
Months sooner to market
Devices you can monitor and update from day one ship to the field sooner.
Yours to use commercially
A one-off licence for your product comes with the project.
See it in action
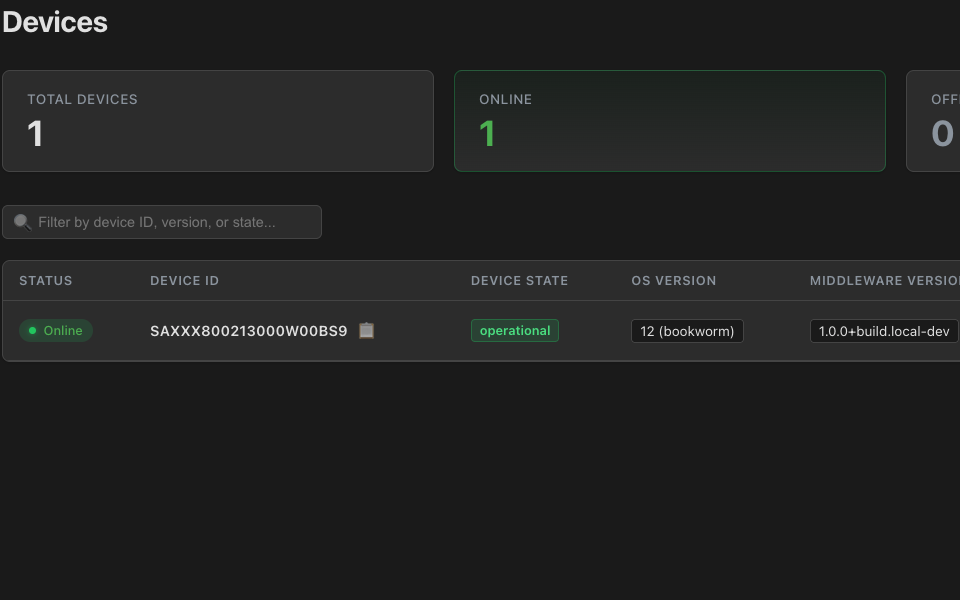
1. Device status
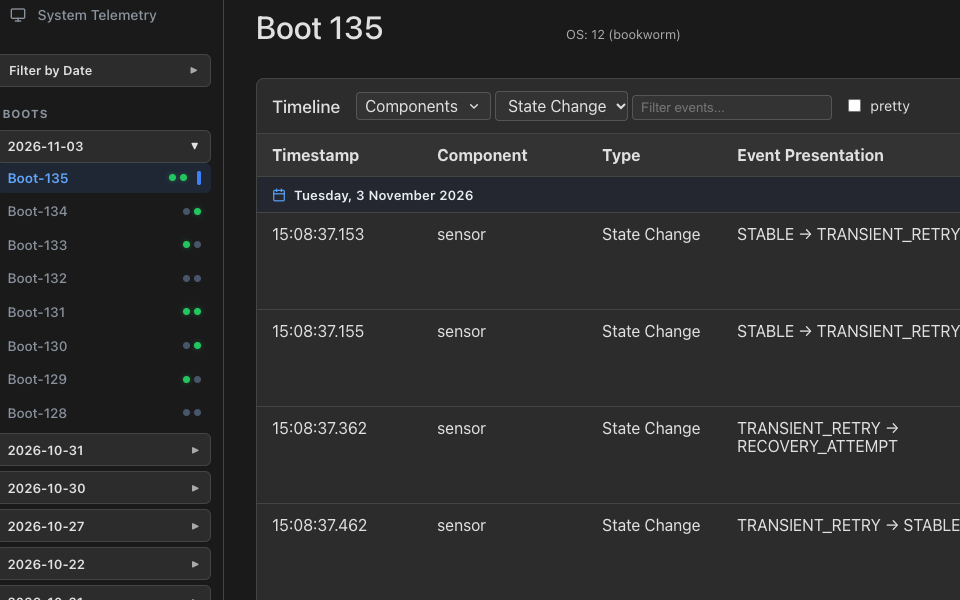
2. State transitions per boot
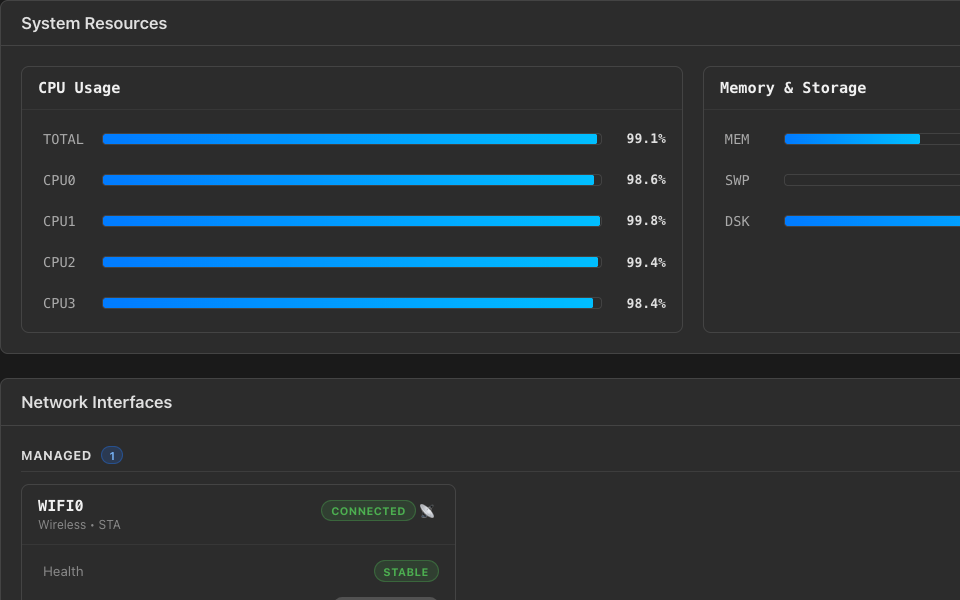
3. Live health: system and network
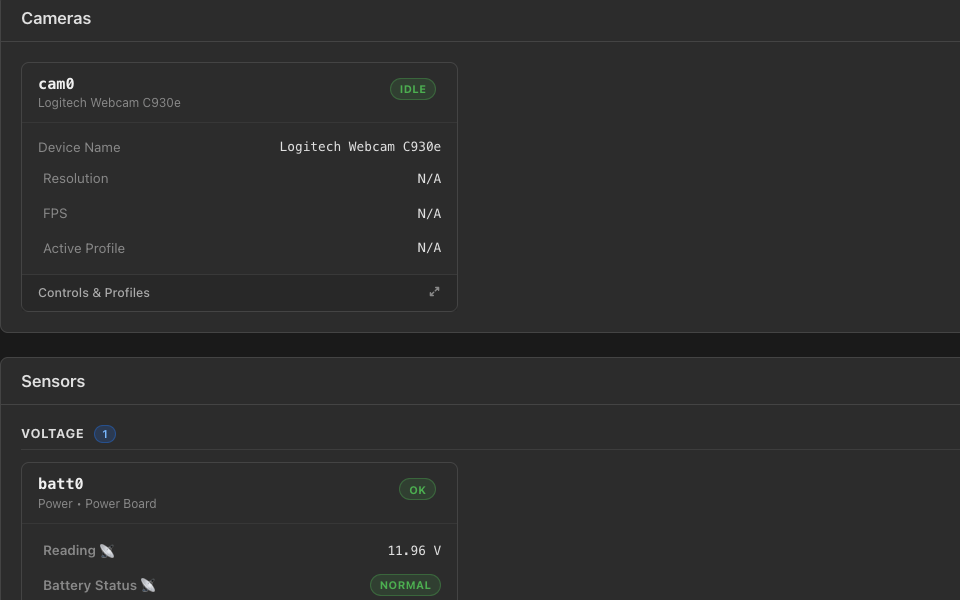
3. Live health: cameras and sensors
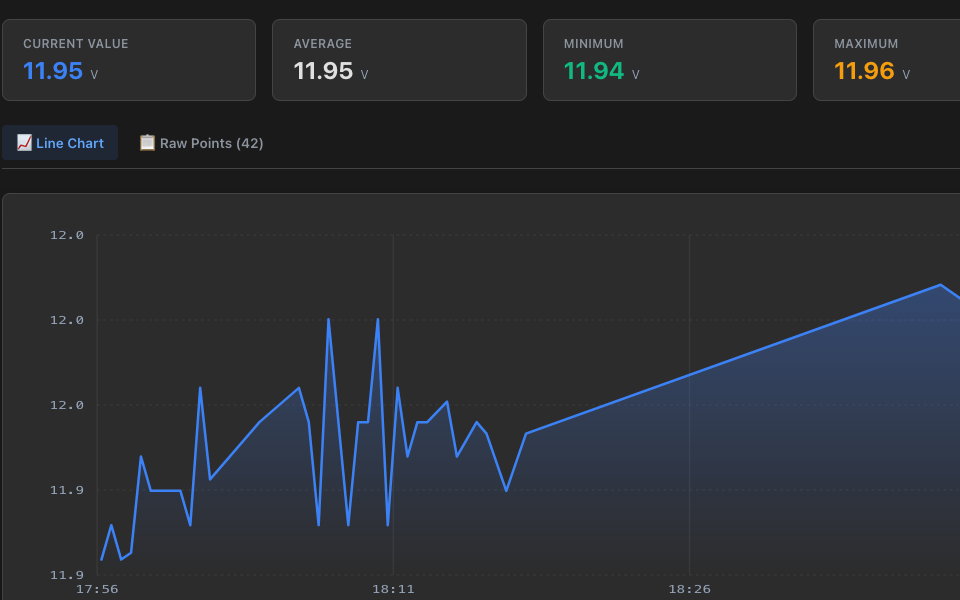
4. Over time, example: battery voltage
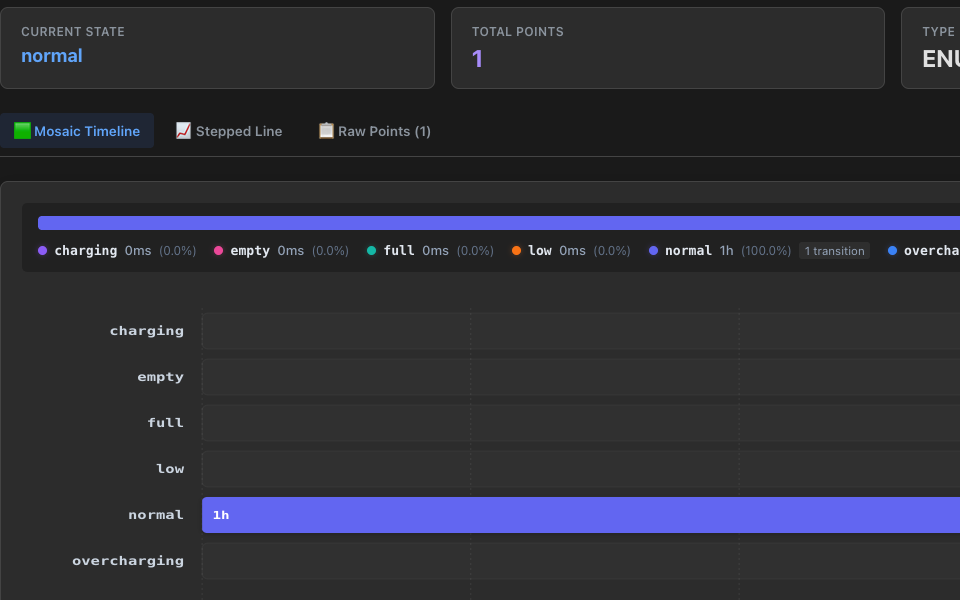
4. Over time, example: battery state
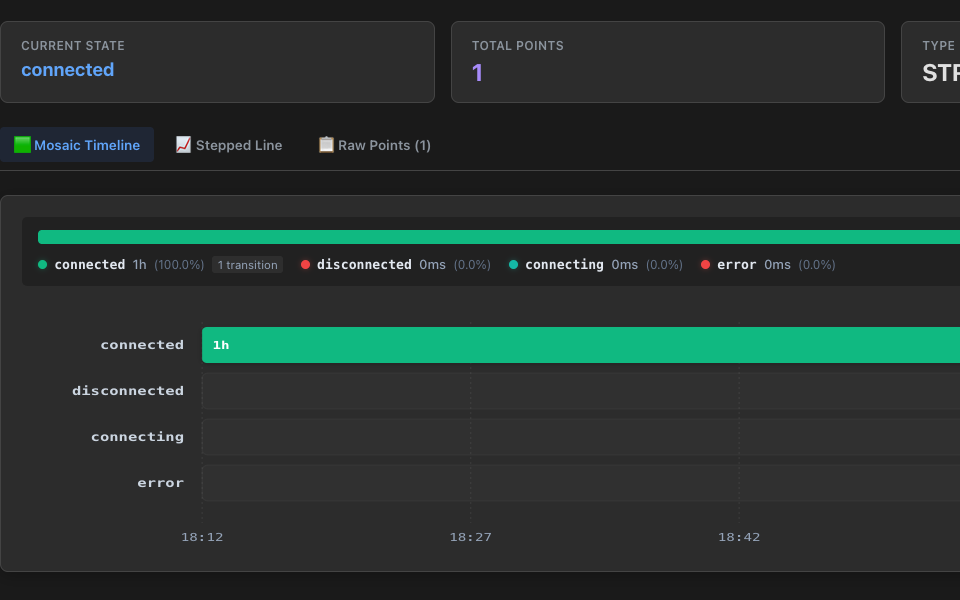
4. Over time, example: connectivity
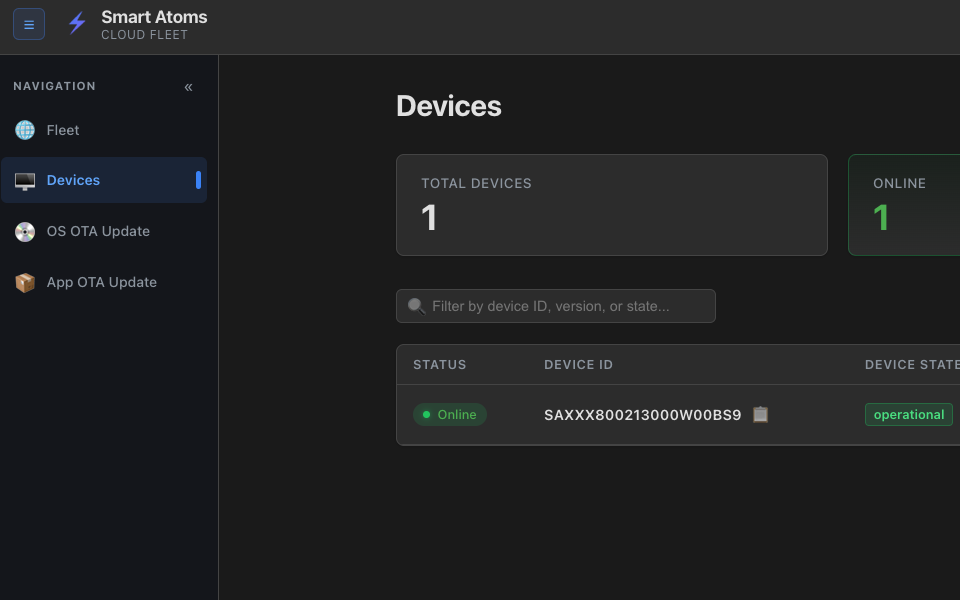
5. OTA updates: OS and app
What it is
A web console and device-side services for embedded Linux fleets, adapted to your hardware, components and cloud.
Edge agent on the device
An agent runs on each device and monitors system performance metrics and states at the edge. It works on its own, also without a cloud connection.
Device status
Online and offline status for every device in the fleet, with OS and software versions and device state.
State transitions per boot
System and component state changes in real time and as history, grouped by boot. See how each component behaves, for example whether it recovers, and follow the exact order of state transitions in every boot to spot where the system gets stuck, all remotely.
Live health monitoring
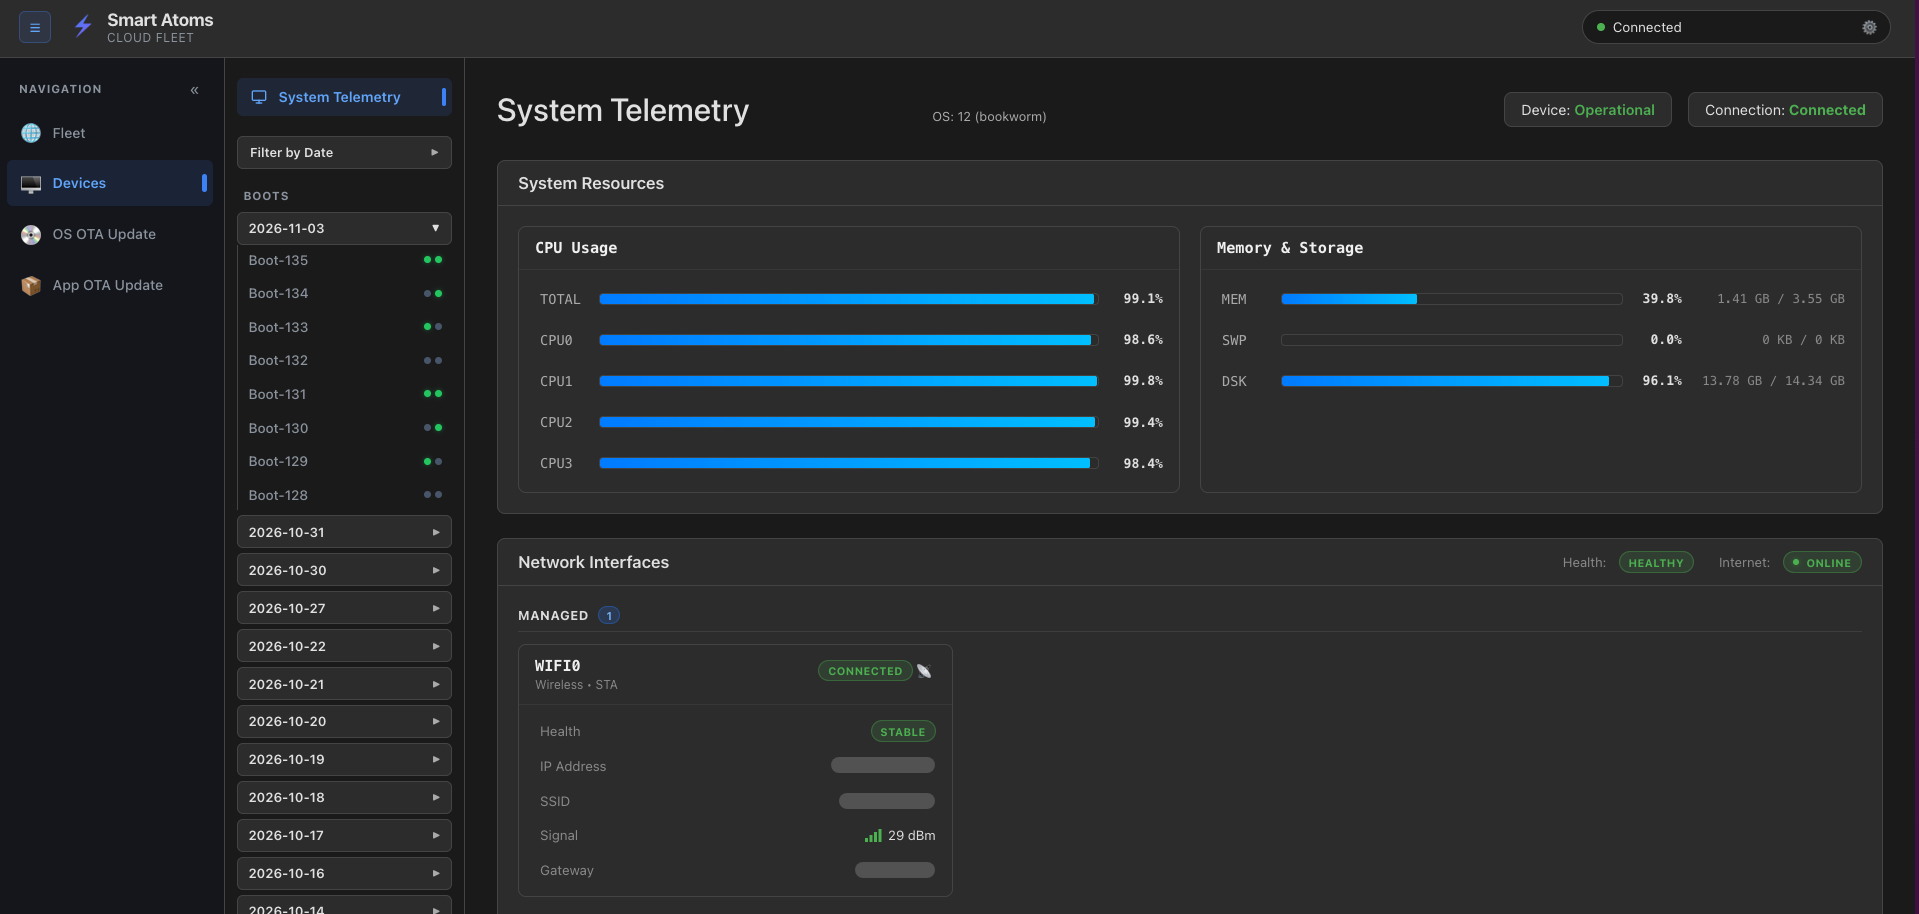
System resources, network interfaces, cameras and sensors with their current values and health, remotely and in real time.
Parameters over time
Pick any system metric for any device in the fleet and track it over time as a chart or timeline, with export. Battery voltage, battery state and connectivity are just examples.
OTA updates: OS and app
OS OTA updates the system software of your devices over the air. App OTA updates the use case on the device, such as an AI model or an AI pipeline, without a full system update.
How we adapt it to your product
1. Map your device
Components, sensors, states and parameters your team and your customers need to see.
2. Connect your devices
Device-side services report status, state changes, health and telemetry to the console.
3. Set up update channels
OS images and application packages, such as AI models, for over-the-air delivery.
4. Run the fleet
Your team operates the fleet from the console; we support and extend it.
Use cases
Edge AI devices
Ship a new AI model or pipeline as an app update, without a full system update.
Battery and energy devices
Watch battery voltage and battery state over time and spot problems early.
Gateways and controllers
See every boot and every state change remotely before a customer calls.
Pilots and field tests
Compare boots and parameters across devices before a wider rollout.
The whole console
Fleet Manager in one view: navigation for the fleet, devices, OS OTA updates and app OTA updates, next to the live telemetry of one device.
Supported platforms
Embedded Linux devices with Wi-Fi, Ethernet or cellular connectivity. Tell us about your hardware and cloud.
Related Case Studies
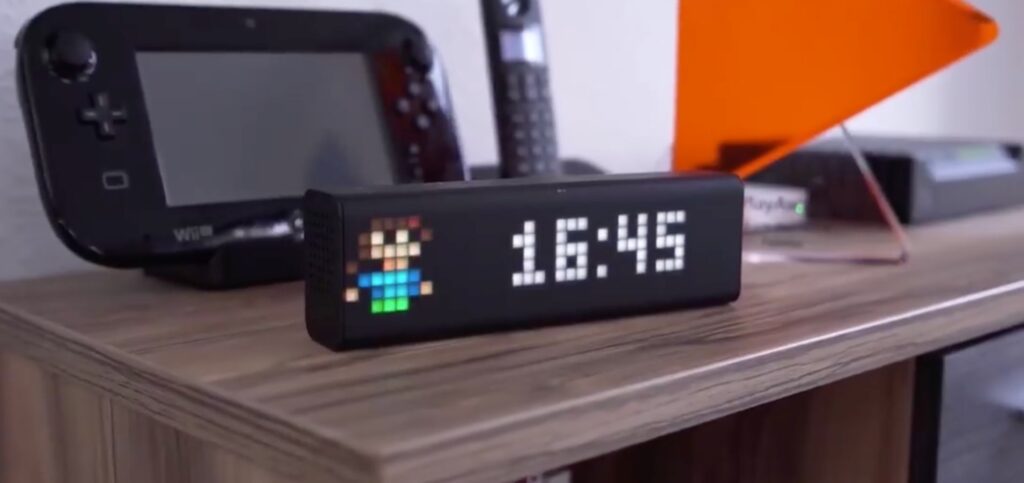
Our own product, end to end: industrial design, electronics, firmware, cloud, volume production and years of OTA updates in the field.

How we engineered a modular light where every panel has its own electronics and firmware, yet any shape on the wall maps itself with one phone scan and updates over the air as one product.
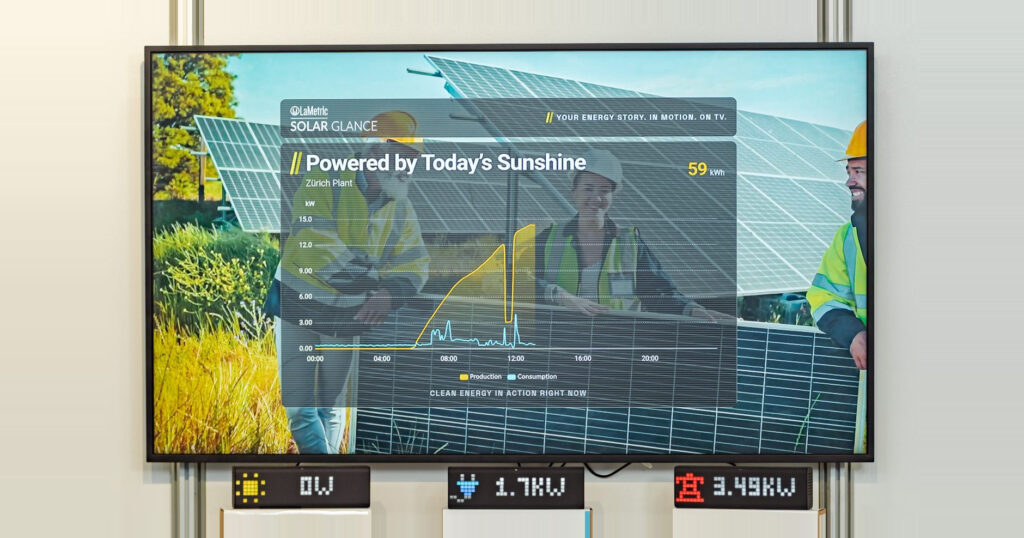
How we turned data from hundreds of inverters, meters and gateways into live, branded screens that install in about 10 minutes and run 24/7, managed and updated over the air.
Planning something similar?
Tell us where you are. A senior engineer replies within one business day.

Talk to an engineer, not a salesperson
Idea, prototype, production or a fleet in the field: tell us where you are. A senior engineer replies within one business day.
Your benefits:
- Senior embedded engineers
- Hardware, firmware and cloud
- From prototype to fleet
- Clear scope and next steps
- Direct technical answers
- No sales pitch
What happens next?
A free 30-minute call with a senior engineer
A short technical discovery
A proposal with scope, timeline and cost